Technology & Innovation
Solar power, IoT sensor arrays, real-time Grafana dashboards, OpenCV computer vision for livestock tracking and predator detection, automated biological systems, and a free mobile health app — all built on open-source tools and designed for replication.
Agriculture 5.0: Where Biology Meets Data
The defining principle of Agriculture 5.0 is that biological systems and digital systems operate as one integrated organism. At AI Sustainable Foods, every animal, every water tank, every grow bed, and every container is instrumented with sensors that feed real-time data into dashboards visible to farm operators, visiting researchers, and the public.
Solar Energy System
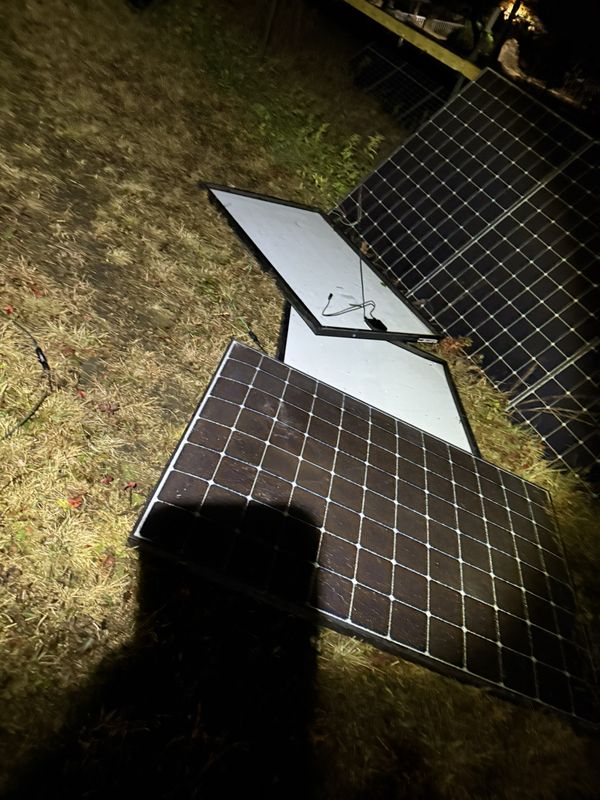
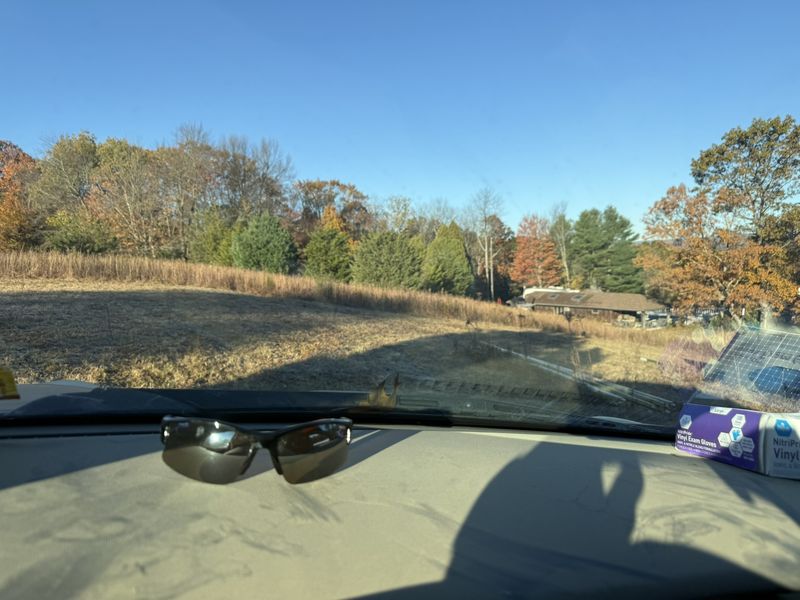
The farm is powered by a 9kW Canton photovoltaic array with 597Ah lithium battery storage. Dual inverters support simultaneous grid-tie operation and battery charging, ensuring that critical systems — fish life support, refrigeration, incubation chambers, and sensor networks — remain powered during grid outages. The system generates more energy on an annualized basis than the farm consumes, making the campus a net energy producer.
Solar production, battery state-of-charge, load consumption, and grid draw are monitored in real time through dedicated Grafana panels. Historical data shows seasonal generation patterns, peak load periods, and battery cycling depth — critical metrics for planning the expansion needed as Containers 3–6 come online. The U.S. Department of Energy Solar Energy Technologies Office reports that small-scale agricultural solar installations in the Northeast achieve capacity factors of 12–15%, which our monitoring data confirms.
IoT Sensor Network & Grafana Dashboards
The operational containers are instrumented with Arduino and Raspberry Pi sensor arrays measuring the environmental and biological parameters specific to each production system. Data is collected every 5 minutes and written to a self-hosted InfluxDB time-series database, then visualized through Grafana dashboards that are accessible to farm staff, visiting researchers, and the general public. Nine dedicated dashboards cover the solar array, each of the six containers, the closed-loop ecosystem metrics, and the livestock AI detection system.
The closed-loop ecosystem dashboard aggregates cross-system metrics: BSF bioreactor input weight, water recycling percentage, feed self-sufficiency ratio, and NPK (nitrogen, phosphorus, potassium) levels in the nutrient cycling streams. This dashboard is the operational proof that the closed-loop model works — it shows, in real time, how much purchased feed and fertilizer the farm has eliminated through biological waste conversion. The USDA Natural Resources Conservation Service (NRCS) tracks nutrient management as a key conservation practice, and our sensor data provides the documentation required for NRCS program participation and SARE research reporting.
OpenCV Livestock Detection & Predator Identification
The farm runs a computer vision system built on OpenCV and YOLOv8 object detection models trained specifically on our livestock. Field cameras provide continuous video feeds that the system processes to count individual chickens and goats, measure flock activity levels, track grazing patterns, and detect behavioral anomalies that may indicate illness or stress. Each detected animal is assigned a bounding box, a species label, and a confidence score (typically 85–98%).
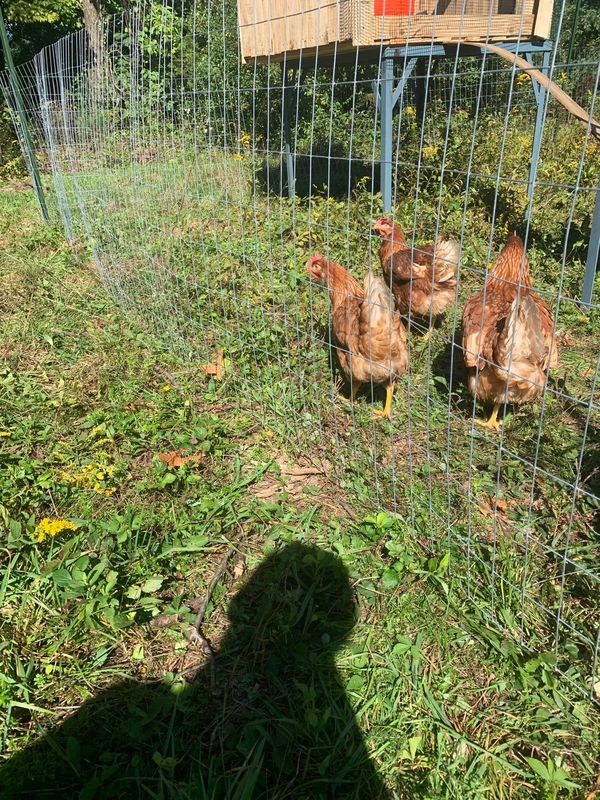
The predator detection module is the critical safety feature. Monroe County, Pennsylvania is home to black bears, red foxes, eastern coyotes, great horned owls, red-tailed hawks, and bald eagles — all of which pose threats to free-range poultry. The system identifies predator species from camera feeds at dawn, dusk, and through the night using infrared imaging. Detection events are logged with species identification, confidence score, threat level, and GPS zone, then pushed to the Grafana dashboard and to the operator’s phone. Automated deterrent systems (lights, sound) activate on high-confidence detections. The USDA APHIS Wildlife Services program documents predator management as one of the top challenges for pastured poultry operations in the eastern United States.
Live Livestock AI — OpenCV Detection Feed
Simulated field camera · 18 chickens + 4 goats with bounding boxes · Predator alerts with species ID
Biological Automation: BSF, Duckweed & Nutrient Cycling
The most powerful “technology” on the farm is not digital — it is biological. The black soldier fly (Hermetia illucens) bioreactor processes 40 lbs of organic waste daily with zero mechanical energy input beyond maintaining temperature at 82–88°F. BSF larvae consume manure, food scraps, and crop residue, converting them into larvae meal (42% crude protein, 35% crude fat) and frass fertilizer (NPK 3-2-2). The larvae will replace purchased fish feed at $0.45/lb versus $1.80/lb commercial pellets — a cost reduction that makes small-scale aquaculture economically viable.
Duckweed (Lemna minor) operates on a similar principle. Grown on nutrient-rich water from the aquaponic and shrimp systems, duckweed will double its biomass every 2.5 days at 30–40% crude protein. It becomes supplemental feed for tilapia, shrimp, and poultry while simultaneously filtering excess nitrogen and phosphorus from the water stream. The USDA Agricultural Research Service has published extensively on duckweed as both a wastewater remediation tool and a high-protein livestock feed, validating both applications that our farm implements simultaneously.
Appetite AI — Free Mobile Health App

Appetite AI is a free mobile health app built on the same sensor data pipeline and biological prediction models that run the farm. The app forecasts 24-hour hunger-satiety cycles by correlating meal timing, wearable data (heart rate, activity, sleep from Apple Watch), and the user’s active fasting protocol. A real-time hunger curve shows when satiety will expire and schedules the next meal at the biologically optimal point. The metabolic phase tracker counts down through Digestion, Post-Absorptive, Fat Oxidation, and Deep Fast stages with real-time biological explanations.
When hunger reaches crisis levels, the SOS Rescue Protocol launches a 45-minute guided recovery with biological triage (Level 7: electrolyte protocol vs Level 10: CCK hormone trigger) and a three-stage timer explaining vagus nerve signaling, CCK/GLP-1 hormone release, and blood chemistry stabilization in real time. Built in Flutter for iOS and Android. Pending Apple App Store and Google Play Store approval. Free, no subscriptions, no accounts required. Try the interactive demo.
Replicability & Open Source
Every technology component on this farm is deliberately chosen for replicability. Arduino boards cost under $30. Raspberry Pi units cost under $75. InfluxDB and Grafana are free open-source software. OpenCV is an open-source computer vision library maintained by a global community. A single container can be instrumented with a complete sensor network for under $500 in hardware. This matters because the goal is not to build one high-tech farm in Pennsylvania — the goal is to build a model that can be shipped in a container to a food desert in Detroit, a refugee camp in Jordan, or a coastal community in Bangladesh recovering from a cyclone. The United Nations Sustainable Development Goal 2: Zero Hunger calls for doubling agricultural productivity of small-scale food producers by 2030. Container-based closed-loop systems, powered by solar and managed by open-source IoT, are a concrete path to that target.
Click Any System to View Dashboard
8 illustrated systems with real-time Grafana sensor data
All Donations Are
Tax-Deductible
509(a)(2) public charity — EIN 93-1895646 — Candid Gold Seal 2026.
Exclusive Donor and Member Benefits
• Free workshop passes
• Behind-the-scenes tours
• Priority CSA subscriptions
• Naming recognition
• Members-only updates
Frequently Asked Questions
What sensors does the farm use?+
Arduino and Raspberry Pi boards collect temperature, humidity, pH, dissolved oxygen, electrical conductivity, CO₂, ammonia, light intensity (PPFD), water flow rates, battery state-of-charge, and solar production. Data is written to InfluxDB every 5 minutes and visualized in Grafana. Nine public dashboards cover every system on the farm.
How does the predator detection system work?+
Field cameras feed video to an OpenCV + YOLOv8 pipeline running on a dedicated GPU. The model identifies six predator species common to Monroe County, PA: black bear, red fox, eastern coyote, great horned owl, red-tailed hawk, and bald eagle. Detection events are logged with species, confidence score (85–98%), threat level, and zone, then pushed to Grafana and the operator’s phone. Automated light and sound deterrents will activate on high-confidence detections.
How much does the solar system produce?+
The 9kW Canton array with 597Ah battery storage generates more energy annually than the farm consumes. Dual inverters provide grid-tie capability with battery backup for critical loads (fish life support, refrigeration, incubation). Real-time solar production data is visible on the Solar dashboard.
What is the Appetite AI app?+
Appetite AI is a free mobile health app that predicts hunger-satiety cycles using the same biological modeling approach that runs the farm’s production systems. It syncs with Apple Watch, tracks metabolic phases, and provides a 45-minute guided rescue protocol for hunger emergencies. Built in Flutter for iOS and Android, pending app store approval. Try the interactive demo.
Is the technology proprietary?+
No. The entire technology stack is built on open-source tools: Arduino, Raspberry Pi, InfluxDB, Grafana, OpenCV, Python, and Flutter. A single container can be instrumented for under $500 in hardware. The model is designed for replication by any farm, school, or community organization.
Can I see the live dashboard data?+
Yes. All nine Grafana dashboards are public. Click any system card in the Live Farm Systems gallery above, or visit the Farm page for container-specific details with direct dashboard links.